Tuesday, June 17, 2014

Housing Market, Already Slowing Economy, Appears Unsustainable


The U.S. housing market was at the heart of the financial crisis that led to the Great Recession. Yet, most of the hopes for our economic recovery have been pinned to a housing recovery.

While there has been some semblance of a recovery (home prices have increased 20 percent nationally over the past two years), it has been uneven, differing greatly from market to market.

The S&P/Case-Shiller 20-City Composite Home Price Index shows that in February prices were back around the same levels as in 2004, though still down from their peak in 2006.

Home prices nationwide, including distressed sales, increased 12.2 percent from February 2013 to February 2014, according to CoreLogic. This change represented 24 months of consecutive year-over-year increases in home prices nationally.

However, the housing recovery has been driven largely by investors, not typical buyers.

Sensing an opportunity, institutional buyers have accounted for a large percentage of home purchases, which has boosted prices. This is not a market driven by normal consumer demand.

All-cash purchases accounted for almost 43 percent of all sales of residential property in the first quarter of 2014, up from almost 38 percent in the previous quarter and 19 percent in the first quarter of 2013, according to data released in May by RealtyTrac.

These investors are eager to make a profit by buying low and renting these properties — or flipping them — which is driving up the number of all-cash deals. Wealthy Americans and downsizing empty nesters also account for some of these all-cash deals.

According to the National Association of Realtors' annual study of consumers, the 2014 Investment and Vacation Home Buyers Survey, investors accounted for 20 percent of market share in 2013, down from 24 percent in 2012.

As a result, the median price of a new home rose to $290,000 in March, the highest level on record, according to the Commerce Department.

This is pricing out many first-time and lower-income buyers. When you look at incomes, it's little wonder.

In April, for example, weekly wages for the average American worker were just 0.2 percent higher compared to a year earlier, adjusted for inflation. And real hourly wages were actually down 0.1 percent in the same one-year span.

In real dollar terms, the median annual income is 7.5 percent lower ($4,309) than its January 2008 high.

This makes the 20 percent increase in home prices over the past two years tough to reconcile. It's even more confounding when you look at the broader inflation rate.

The latest annual inflation rate for the United States is 2.1 percent through the 12 months ended May, as published by the US government on June 17, 2014.

So the rise in home prices is wildly out of line with general rise in prices throughout the economy.

As previously noted, this is hurting first-time buyers, many of whom tend to be younger.

The Millennial generation, in particular, is being squeezed out of the housing market. This group is not only contending with rising home prices, but also tighter lending standards, tight supplies and high student loan debts.

Some graduates end up paying off student loans well into their 30s and even 40s. As a result, many Millennials simply can't come up with hefty 20 percent down payments. Others don't have good enough credit to qualify for loans.

Consequently, just 36 percent of Americans under the age of 35 own a home, according to the Census Bureau. That's down from 42 percent in 2007 and it's the lowest level since 1982, when the agency began tracking homeownership by age.

Yet, it's not just Millennials. Home ownership, in general, is on the decline.

Just 74.4 million American households — less than 65 percent of the country — owned the homes they lived in during the first quarter of this year, according to a recent U.S. Census Bureau report.

That was the lowest level since 1995 and a big drop from 2006, when a peak of 76.5 million households, or 68.9 percent, were owner-occupied.

The price of homes, the lack of sufficient down payments, and stricter lending standards have killed any hope of ownership for millions of Americans. What was long considered the "American dream" is no longer the dream for a huge percentage of people.

According to a May poll by the National Endowment for Financial Education, only 13% of Americans considered home ownership as their “top long term financial goal,” down from 17% in 2011.

Lending standards should indeed remain strict. Lax standards helped to drive the housing bubble in the first place. But the stagnation in wages has thwarted the ability of millions of Americans to save for a down payment, or service a mortgage.

The rise in home prices is a two-sided coin. It's been great for owners that have been underwater, and for those seeking to sell their homes. But it's hurt millions of other would-be buyers.

The question is whether the increases in home prices can be sustained. It doesn't seem likely, since it is so out of line with precedents.

Historically, home prices have appreciated nationally at an average annual rate between 3 and 5 percent, according to Zillow, though different metro areas can appreciate at markedly different rates than the national average.

This historical average is important to consider as we look for signs of another housing bubble.

Again, home prices nationwide, including distressed sales, increased 12.2 percent in February 2014 compared to February 2013, according to CoreLogic.

So, price increases over the past year are anywhere from 244 percent to 406 percent above the historical national average.

Cause for concern? Perhaps. This certainly isn't normal appreciation.

Additionally, as interest rates have slowly risen, institutional investors — people or companies that have purchased at least 10 properties in a calendar year — have been gradually leaving the market.

Investors accounted for 5.6 percent of all U.S. residential sales in the first quarter, down from 6.8 percent in the fourth quarter of 2013 and 7 percent in the first quarter of 2013.

One way or anther, this market looks quite tenuous. Incomes don't match home prices, and mortgage rates will only tend to rise.

As it is, the housing market is already slowing down.

New-home construction fell 6.5 percent in May.

Meanwhile, existing home sales saw a 3.4 percent increase in March. However, that was the first gain in nine months. And in April, existing home sales increased just 0.4 percent.

The housing market was a drag on the economy in each of the last two quarters.

Housing cut economic growth in the first quarter, as it did in the fourth quarter of 2013, resulting in the sector’s first back-to-back subtraction since the first half of 2009.

That trend could continue into the second quarter, and beyond.

Clearly, this is something we should watch closely in the months ahead.

Sunday, June 08, 2014

Economy Finally Recovers All Jobs Lost in Recession; Still Not Enough


The good news from the latest Bureau of Labor Statistics (BLS) report was that the U.S. economy added 217,000 jobs in May.

This means the U.S. labor market has finally surpassed its pre-recession level of employment (last seen in December 2007), making this the longest employment recovery in the postwar era.

Think about how much damage the Great Recession caused to our economy; it's taken 6 1/2 years to get back to our former employment level.

However, even after taking into account the number of people who have retired in that span, millions of additional workers have since entered the labor market, meaning we need millions of additional jobs to create adequate employment for everyone that wants full-time work.

For example, over this period, the U.S. civilian population increased by nearly 14.5 million people, but the labor force grew by just 1.7 million new jobs, according to BLS data.

When the media and government discuss the unemployment rate, they typically refer to what is known as the "U-3" unemployment rate. In May, that number was 6.3 percent.

However, the "U-6" figure provides a broader measure of the unemployment rate. When this number is viewed, things don't look nearly so rosy.

The "U-6" includes two groups of people not calculated in the "U-3" figure:

1. "Marginally attached workers" — people who are not actively looking for work, but who have indicated that they want a job and have looked for work (without success) sometime in the past 12 months. This group also includes "discouraged workers" who have completely given up looking for a job because they feel that they just won't find one.

2. People who are looking for full-time work, but who have settled for part-time work due to economic reasons. In essence, these people want full-time work, but simply can't find it.

These are critical distinctions that make "U-6" a far more accurate representation of true unemployment.

The U-6 unemployment rate was 12.2 percent in May, according to the Bureau of Labor Statistics (BLS). That's nearly twice the 6.3 percent figure most often cited by the government and media.

What this means is that there are 23.5 million Americans who either want a job, or want to work full-time, but can’t due to the weak economy.

That is a massive number.

Though this figure is down nearly 5 million from the peak of 30.4 million four years ago, it’s still up 7.5 million from the pre-recession level of 16 million.

With 23.5 million people either unemployed or only working part-time, employers can hold the line on wages and salaries.

Over the past year, average weekly earnings have risen 2.1% — about the same as the 2% increase in consumer prices. That has negated the marginal rise in earnings.

Median usual weekly earnings of full-time wage and salary workers, adjusted for inflation, have actually declined since the end of the recession, according to government data.

A significant part of the problem is that this jobs recovery has been too reliant on low-wage jobs. In fact, low-wage jobs have accounted for two-fifths of all new jobs added.

The bulk of new jobs have been in food services, temporary help services, retail trade, and long-term health care — industries known for low wages.


For example, employment in temporary jobs accounts for 10% of overall employment gains in the recovery, while employment in accommodation and food services accounts for another 17% of total new employment.

Low wage jobs won't address our economy's fundamental problem, which is a lack of demand. Consumers aren’t consuming enough to spur the economy because they don't have the means to do so.

So, while finally recovering all the jobs lost in the Great Recession is certainly good news, it's clear that we need millions of additional jobs — specifically good-paying, middle-class jobs — before we can really celebrate, or think we've returned to anything resembling "normal."

Saturday, May 31, 2014

Dream of US Shale Oil Revolution Goes Up in Smoke


A rather astonishing thing happened about a week ago. It was undoubtedly one of the biggest stories of the year, and it has implications for the United States for years to come.

Yet, you may have completely missed this stunning news.

The U.S. Energy Information Administration slashed by 96% the estimated amount of recoverable oil buried in California's vast Monterey Shale deposits.

Why is this such big news?

The Monterey Shale formation, a 1,750 square-mile area, contains about two-thirds of the nation's shale oil reserves.

In other words, nearly two-thirds of the US shale oil that was previously believed to be recoverable is not. A 96% reduction is a virtual wipeout.

The Monterey formation was previously believed to contain more than double the amount of oil estimated at the Bakken shale in North Dakota, and five times as much as the Eagle Ford shale in South Texas.

But — POOF! — just like that, the contention that shale oil would generate US energy independence, and lead us to surpass Saudi Arabia in production, went up in smoke.

Only 600 million barrels of oil can be extracted with existing technology from this vast stretch of Central and Southern California, far below the 13.7 billion barrels once thought to be recoverable.

To put that into perspective, at current usage levels, 600 million barrels would meet US oil demand for just 33 days. Yes, you read that correctly.

The energy agency said the earlier estimate of recoverable oil, issued in 2011 by an independent firm under contract with the government, broadly assumed that deposits in the Monterey Shale formation were as easily recoverable as those found in shale formations elsewhere.

Apparently, they are not.

Oil driller Occidental, which owns most of leases in the Monterey Shale, earlier this year put its California business up for sale in part due to lagging oil production.

Fracking — the process of injecting millions of gallons of water laced with sand and chemicals deep underground to crack shale formations — has not been productive in the area, which runs down the center of California roughly from Sacramento to the Los Angeles basin and includes some coastal regions.

This is a stunning reversal, and it's a reminder of that old adage: Don't count your chickens before they hatch.

It was previously believed that an oil boom would bring millions of new jobs to California and boost tax revenue by tens of billions annually.

All of those rosy projections were wiped out the instant this news was announced on May 21.

It's hard to overstate what an enormous blow this is to US energy interests.

For California, in particular, this is a huge setback for the economy and for anticipated tax revenues.

In 2013, a USC analysis, funded in part by the Western States Petroleum Association, predicted that the Monterey Shale formation could, by 2020, boost California's gross domestic product by 14%, add $24.6 billion per year in tax revenue, and generate 2.8 million new jobs.

The fact that none of this is true is a kick in the gut to the Golden State. And it could lead to a national oil shock in the coming years that would be devastating to the US economy and our way of life.

If we're ever going to develop energy independence, it will have to come from other means. The shale oil "revolution" was a myth from the beginning, and one that has quickly gone bust.

Perhaps this news will compel California to instead focus more on developing and advancing renewable energy.

That would provide a happy ending to this truly remarkable story.

Thursday, May 15, 2014

Global Population & Global Resources Rapidly Moving in Opposing Directions


The growth of the global population over the last century is nothing short of extraordinary. But humanity's exponential growth is going to pose some great challenges and difficulties for us in the decades ahead.

The world population was an estimated 1.564 billion 1900. However, as of July 2013, the world population had reached an estimated 7.152 billion, according to the United States Census Bureau.

Quite remarkably, the global population quadrupled in the 20th Century.

Population growth in the West became more rapid after the introduction of compulsory vaccinations, and improvements in medicine and sanitation.

However, global population growth was largely driven by greatly increased by food production (which, in turn, was driven by fossil fuels in the form of natural gas-derived fertilizers, oil-derived pesticides, and hydrocarbon-fueled irrigation) that allowed this massive expansion.

As the following chart shows, the global population was relatively stable for many centuries, but then skyrocketed upon the discovery of crude oil.


Absent adequate crude oil and oil-based fertilizers, this population boom cannot continue. Furthermore, billions of additional humans will use vastly greater quantities of resources, many of which are non-renewable and therefore unsustainable.

The UN projects steadily declining population growth in the near future. However, the global population is still expected to reach somewhere between 8.3 and 10.9 billion by 2050.

Yet, some analysts question the sustainability of further world population growth, highlighting the growing pressures on the environment, global food supplies, and energy resources.

For example, the UK government's chief scientific advisor, Professor John Beddington, warns that the world will require 50% more energy, food and water by 2030. And, according to a 2009 report by the United Nations Food and Agriculture Organisation (FAO), the world will have to produce 70% more food by 2050 to feed what is projected to be as many as 3.8 billion additional people.

However, higher oil prices, the loss of arable land, and the effects of climate change will inevitably drive grain and food prices much higher, perhaps beyond the reach of billions of the world's poorest inhabitants.

Around the world, fish stocks are being depleted due to overfishing. This is quite problematic since so many people are reliant on our oceans for food. Presently, about 40% of the world’s population lives within 100 kilometers (64 miles) of the coast, and they eat a lot of seafood.

However, the global fishing fleet is 2-3 times larger than what the oceans can sustainably support, according to the World Wildlife Fund (WWF).

As a result, says WWF, 53% of the world’s fisheries are fully exploited, and 32% are overexploited, depleted, or recovering from depletion. Additionally, most of the top ten marine fisheries, accounting for about 30% of all capture fisheries production, are fully exploited or overexploited.

Unless the current situation improves, says WWF, stocks of all species currently fished for food are predicted to collapse by 2048.

That's really bad timing for humanity since the global population is projected to peak as high as 10.9 billion people by mid-century. Apparently, we'll have to scratch seafood off future menus. That will make feeding all those additional billions of humans really challenging, if not impossible.

We'll also have to reevaluate our farming practices and start doing things in a far more efficient and sustainable manner to avoid mass starvation. The main issue going forward will be water. Around the globe, as the population has soared, our consumption of water has grown exponentially.

As a result, our water aquifers are emptying at an alarming rate. For example, the Ogallala Aquifier, which covers 30 percent of the United States' irrigation needs, could be mostly depleted by 2060 if current trends continue.

One of the world's leading resource analysts, Lester Brown, has warned that 18 countries — together containing half the world's people — are now overpumping their underground water tables to the point where they are not replenishing and where harvests are getting smaller each year. This is what's known as "peak water."

Clearly, the way we presently use fresh water is unsustainable. The realities of global population growth and water supplies are now colliding.

Case in point: Nearly half of all the water used in the United States goes to raising animals for food.

It takes more than 2,400 gallons of water to produce one pound of meat. However, growing one pound of wheat only requires 25 gallons.

While the Earth has 57 million square miles of land (36.48 billion acres), there are just 12 million square miles (7.68 billion acres) of arable land (agricultural land). This amounts to just 21 percent of all the land on earth, a number that should raise some serious concerns in everyone.

Yet, due to erosion, that number is dwindling. In fact, arable land is being lost at the alarming rate of over 38,610 square miles (24.7 million acres) per year.

This is indicative of a populace that is using ever more precious resources — and in some cases non-renewable resources — at an ever expanding rate in order to meet the needs of a burgeoning global population.

Humans now need the equivalent of 1.5 planets to sustain us, and by the 2030s it will have risen to two planets. The problem, of course, is that we have only one planet.

Again, according to that previously referenced 2009 report by the United Nations Food and Agriculture Organisation (FAO), the world will have to produce 70% more food by 2050 to feed what is projected to be an extra 2-3 billion people.

Quite alarmingly, a leading Australian scientist says the world will have to produce more food in the next 50 years than we have in the thousands of years since civilization began. That's a daunting prospect.

How could this ever be accomplished? Such a goal sounds absolutely fantastical.

In this century, we will finally bump up against the limits of resource extraction. Going forward, the life we have always taken for granted will ultimately be limited by resource constraints.

Sadly, our entire way of life is plainly unsustainable. Humans are now depleting all the natural resources the Earth can provide for the year in less than three-quarters of a year, according to the Global Footprint Network.

In 2013, humanity used as much of nature as the Earth can regenerate in a year in less than nine months.

As Herb Stein's Law states with such elegant simplicity, "If something cannot go on forever, it will stop."

'Earth overshoot day' is the point in the year that humans have exhausted supplies such land, trees and fish, and outstripped the planet's annual capacity to absorb waste products including carbon dioxide.

This is calculated by comparing the demands made by humans on global resources — our 'ecological footprint' — with the planet's ability to replenish resources and absorb waste.

Earth overshoot day fell a couple of days earlier in 2013 than it did in 2012. It was part of a troubling and ongoing pattern — one that is plainly unsustainable.

The Global Footprint Network said that in 1961, humanity only used around two-thirds of the available natural resources on Earth, but by the 1970s increased carbon emissions and consumption began to outstrip what the planet could provide.

The report reiterated what other researchers and scientists had said before: humans now need the equivalent of 1.5 planets to sustain us, and by mid century it will have risen to two planets.

So what does this mean for humanity? Well, the prospects are frightening.

According to a new joint-university study, utilizing NASA research, society could collapse in just a few decades.

The report lists five risk factors for societal collapse: population, climate, water, agriculture and energy. The convergence of food, water and energy crises could create a 'perfect storm' during the lifetimes of many of us presently living.

The study says that all societal collapses over the past 5,000 years have involved both "the stretching of resources due to the strain placed on the ecological carrying capacity" and "the economic stratification of society into Elites [rich] and Masses (or "Commoners") [poor]."

The latter is a topic that I won't even get into here and now, but I have previously covered inequality and the vanishing American middle class many times.

While some are surely inclined to believe that technology will ultimately save us, the report dismisses that notion.

"Technological change can raise the efficiency of resource use, but it also tends to raise both per capita resource consumption and the scale of resource extraction, so that, absent policy effects, the increases in consumption often compensate for the increased efficiency of resource use."

These are scary prospects. Consequently, they are difficult topics for many of us to discuss, much less accept. But simply ignoring them will not make them go away. Massive, historic, and unprecedented changes are already underway.

We must adapt, and we must do so quickly. The global population and our global resources are rapidly moving in opposing directions. This will result in desperate and unforgiving outcomes for billions of people around the world.

The path we are on is inherently unsustainable. The world must immediately focus its efforts on conservation and efficiency, with a particular emphasis on renewability. And, of course, there's the whole matter of birth control.

The time is now. This won't wait.

Saturday, May 10, 2014

Corporate Profits vs. Wages: The Great Divide


Corporate profits, both in dollar terms and as a share of the economy, are at an all-time high. Additionally, worker productivity is also at an all-time high.

Yet, American workers are seeing the benefits of neither.

From 1973 to 2011, worker productivity grew 80 percent, while median hourly compensation, after inflation, grew by just one-eighth that amount, according to the Economic Policy Institute. And since 2000, productivity has risen 23 percent while real hourly pay has essentially stagnated.

Even as American workers have grown continually more productive, they aren't being fairly compensated for all their efforts.

For example, had the minimum wage kept pace with gains in the country's productivity since 1968, it would be $16.54 an hour today.

Sadly, for millions of workers, wages have flatlined. In fact, wage growth is near its lowest level in half a century. And stagnant wages have led to steadily worsening income inequality.

Wages have fallen to a record low as a share of America’s gross domestic product. Until 1975, wages almost always accounted for more than 50 percent of the nation’s GDP, but in 2012 wages fell to a record low of 43.5 percent. And that percentage has been falling steadily since 2001.

Meanwhile, fuel, food, health and education costs have all risen steadily. In other words, people are being squeezed from both ends.

Companies have boosted profits to record levels by employing as few workers as possible, at as low a pay rate as possible. Money that should be paid to workers for their labors is instead being siphoned off to further enrich wealthy CEOs and other top corporate officers.

Today, American CEOs get paid 354 times more than the typical worker. But back in the 1980s, CEOs "only" got paid 42 times more.

So, while corporations reap all the benefits of record profits, American workers continue to suffer and decline.

The US cannot return to the higher growth rates of the past if workers keep getting a smaller share of profits, while watching their purchasing power continually diminish.

Historically, from 1948 through 2013, the United States annual GDP growth rate averaged 3.21 percent.

Yet, over the last two decades, as with many other developed nations, US growth rates have been decreasing. In the 1950’s and 60’s the average growth rate was above 4 percent. In the 70’s and 80’s it dropped to around 3 percent. But in the last ten years, the average rate has been below 2 percent.

It should surprise no one that the US economy has reached the 4 percent growth mark in just two of the 19 quarters since the Great Recession ended. Call it the new normal.

I've made the same argument repeatedly: Absent adequate and fair wages, the US economy will remain incapable of growing in a way that was previously considered normal or acceptable. In the current environment, demand and consumption are inadequate to sustain previous growth rates.

Put it this way: If you owned a car dealership, would you rather have one rich customer that can afford a $100,000 car, or 10 customers that can afford $25,000 cars?

We are seeing what happens when too much wealth — too big a slice of record corporate profits — is hoarded by the moneyed corporate class.

Thursday, May 01, 2014

US Economy Contracts 1.0% in First Quarter. Aberration or Omen?


Troubling news: The U.S. economy shrank in the first three months of 2014.

Gross domestic product contracted at a 1.0% annual pace in the first quarter, according to the U.S. Bureau of Economic Analysis.

It's the first time that's happened in three years, and only the second time since the Great Recession ended in mid-2009. The last negative quarter was in early 2011, when growth fell by 1.3%.

Slumps in exports, housing and business investment, especially on equipment, were the main drivers behind the weak performance.

Some are blaming the impact of harsh winter weather for the downturn. If that's the case, we'll see a vigorous rebound in the second quarter. But I think the problems are much deeper than that.

The latest GDP figures are based on incomplete data and will be revised at least two more times in the coming months.

One way or another, it's a huge comedown since fourth quarter 2013 GDP was 2.6%.

I'm dubious that weather is the only reason for the pullback. Household incomes remain depressed, which is crushing demand and consumption.

In 2012, inflation-adjusted household income was $51,017. Yet, back in 1989, it was $51,681. Incredibly, household income is now lower than it was a quarter-century ago.

Additionally, Americans no longer have mortgage equity extractions to help fuel their spending binges, as they did in the previous decade. Mortgage equity withdrawal was responsible for more than 75% of GDP growth from 2003 to 2006.

However, in the forth quarter of 2013, net equity extraction was minus $46 billion, or a negative 1.5% of disposable personal income (DPI).

These are different times. The housing market remains on shaky ground more than six years after the bubble burst. Recent data shows weak building rates, as well as slow sales for both new and existing homes.

Sales of new single-family homes plunged 14.5% in March. New-home sales averaged an annual pace 434,000 in the first quarter. But sales had averaged 1.1 million annually from 2001-2005. Additionally, existing-home sales in March slowed to their slowest rate since July 2012.

These downturns compelled the federally controlled mortgage-finance giants Fannie Mae and Freddie Mac to recently cut their forecasts for the housing market’s performance in 2014.

It's little wonder.

Housing cut economic growth in the first quarter, as it did in the fourth quarter of 2013, resulting in the sector’s first back-to-back subtraction since the first half of 2009. Specifically, housing cut almost two-tenths of a point from the first quarter’s overall growth. That drop followed a cut of almost three-tenths of a point during the fourth quarter.

The median sales price of new homes sold in March was $290,000, the highest rate ever. The combination of rising prices and rates are creating a drag on sales, which could further undermine the economy.

The housing boom of the last decade was a boon to the economy. People weren't just buying houses; they were also remodeling and furnishing them. Those days are over.

It should surprise no one that the economy continues to struggle.

Economist Noriel Roubini says the US economy seems to grow only during a bubble, such as the Internet bubble of the 1990s and the housing bubble of the 2000s. He's right.

The Federal Reserve creates every bubble through its monetary policy. And it's doing it again. As a result of its zero interest rate policy (ZIRP), the Fed has spurred Wall Street's five-year bull market rally.

Yet, at the same time the nation continues to endure a weak five-year economic recovery. It's quite incongruous.

In essence, the stock market rally is benefitting a relative few. As Wall St. booms, Main St. continues to struggle.

Since the economic recovery began in mid-2009, annual growth has hovered around 2%, well short of the nation’s historical average of 3.3%.

Again, this is simply because there is less household income today than before the Great Recession. Yet, instead of continuing to spend more than they earn, Americans are finally showing a bit of restraint.

Though consumer spending rose 3% in the first quarter, the increase was largely due to big spikes in utilities (heating costs rose due to the cold weather), as well as higher outlays on health services related to the enactment of the Affordable Care Act (aka,Obamacare).

Given that millions of additional Americans are now purchasing health insurance, health-care spending, as a percentage of GDP growth, was the highest ever recorded. Consequently, spending on services jumped 4.4%, the biggest increase in almost 14 years.

The other side of the coin is that spending on goods rose a much narrower 0.4%, the weakest gain in nearly three years.

In essence, people are spending their money on necessities, not on luxury items, entertainment, vacations and other non-essential goods and services. Wages and employment simply aren’t allowing greater spending.

While average credit card debt per indebted household was $17,630 at the end of the first quarter of 2010, it has dropped to $15,191. That four-year decline is substantial.

Overall, consumer debt is now 9.1% below its 2008 peak of $12.68 trillion, according to the Federal Reserve.

Perhaps Americans have concluded that increasing their personal debt is not the same as having discretionary income. After all, overspending and an inability to manage debts is what helped to initiate the Great Recession in the first place.

All of this indicates that the economy will continue to struggle, and that growth will remain a challenge going forward.

It will be interesting to see if anyone continues to blame the 'weather', rather than the more obvious and uncomfortable realities behind our economic stagnation.

Thursday, April 10, 2014

If/When Treasury Yields Revert to 30-Year Average, Prepare For Shock & Awe


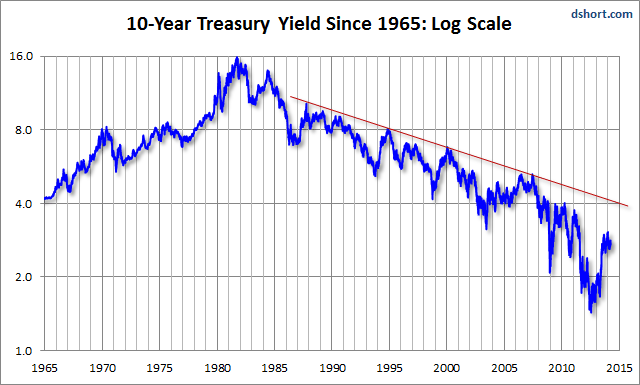
In recent years, the yield on the 10-year U.S. Treasury has fallen to unprecedented levels. In fact, the 10-year note reached an all-time low of 1.38% in July of 2012. That was the lowest level in 200 years.

For comparison, the all-time high of 15.84% was reached back in 1981.

Though the 10-year Treasury is currently yielding 2.69%, which is 95 percent higher than the record-low set nearly two years ago, it is still extraordinarily low by almost any measure.

Without some perspective, the above figures may seem trivial or inconsequential. In order to have some meaning, a little historical perspective is in order. So, I dug into the Treasury Department data and did a little research:

Over the 40-year period from 1974 to 2013, the yield on the 10-year Treasury averaged 6.89%.

Over the 30-year period from 1984 to 2013, the yield on the 10-year Treasury averaged 5.93%.

Over the 20-year period from 1994 to 2013, the yield on the 10-year Treasury averaged 4.60%.

Over the 10-year period from 2004 to 2013, the yield on the 10-year Treasury averaged 3.51%

Over the five-year period from 2009 to 2013, the yield on the 10-year Treasury averaged 2.68%.

So, the current yield is hovering right around that five-year average. But the trend is clear; the 10-year Treasury has been falling for the last few decades. And, as the following chart (courtesy of Doug Short) reveals, the rate has been in long term decline since the early 1980s.


However, we can also see that the ultra low rates of the past five years have pulled down those longer term averages quite a bit. In other words, the current period is clearly atypical of the past.

The lower yields in recent years have been a boon to home owners, who have benefitted from the correspondingly low 15- and 30-year mortgage rates.

But those low yields have also been of great benefit to the federal government, which has been able to borrow at exceptionally low rates to fund its deficit spending.

However, if the interest rate on the national debt rises to just the 20-year-average of 4.60 percent, an enormous portion of tax revenue would go toward paying the interest — leaving insufficient funds for healthcare, food stamps, bridges and roads, social security, or defense. You name it, and it would be either underfunded or unfunded.

The Congressional Budget Office (CBO) says it, "expects interest rates to rebound in coming years from their current unusually low levels, sharply raising the government’s cost of borrowing."

That's a troubling projection considering our $17.5 trillion national debt, as well as how much tax revenue the government currently spends servicing that debt.

The United States spends about $230 billion a year in finance payments to creditors. To put $230 billion a year in perspective, "It's more than the U.S. spends at the departments of Commerce, Education, Energy, Homeland Security, Interior, Justice, State and the court system combined," says Erskine Bowles, the Democratic co-chair of President Obama's National Commission on Fiscal Responsibility and Reform.

When rates inevitably rise to levels more in line with the 20-year average of 4.60 percent, the costs will be crippling. Again, the current yield of 2.69% is 58 percent lower than the 20-year average. That's a sobering perspective.

Again, remember that the current 10-year Treasury yield is already 95 percent higher than the all time low set less than two years ago. Yet, the yield is still low by historical standards. When rates are this low, even small increases make a big difference.

Very small absolute changes in interest rates are large proportionately when the primary interest rate is very low. That's why the market has been thrown into such turmoil over rather small changes in interest rates during the past year or so.

For example, if the 10-year Treasury moves from 2% to 2.50%, that half-point increase actually represents a proportionate increase of 25%, which is substantial.

However, when rates are at 5%, a half-point increase isn't as impacting.

Of course, the U.S. will pay its debts. The government will just have less money to pay for all the domestic needs that most of us perceive as vital to a highly functioning society — the kind of things we have come to think of as "normal" — such as healthcare, food stamps, bridges, roads, social security, defense, etc.

Such an outcome would negatively affect the broader economy.

As long as any government can continue to access the debt markets to fund its spending, it can conceivably continue deficit-spending in perpetuity without getting into too much trouble. It just needs to continually pay its creditors on schedule.

But if the debt markets become dubious about a government's ability to service its debts, that government would end up paying exorbitant interest rates to continue borrowing, which just makes its existing debt problem even worse. Think Greece.

Additionally, if debt service begins to occupy so much of a government's budget that it robs from critical government functions, then the debt level would begin to affect economic growth.

No matter how you slice it, when interest rates eventually rise to more traditional levels, it will create some really ugly scenarios.

Of course, this doesn't even begin to consider the fact that higher interest rates would affect all facets of our society and economy. The only ones that would benefit would be savers, which in itself would be a good thing.

It's just really important for all of us to consider where we are in the historical timeline, and that everything eventually reverts to the mean.

From January of 1962 to October of 2013, the 10-year Treasury note averaged 6.57 percent. It won't have to rise to even 5 percent to send shock waves throughout our economy and government.

What's behind these historically low rates? It's mostly a byproduct of the uncertainty in global markets and a flight to the perceived safety of U.S. Treasuries. The high demand drove down yields. When demand is high, the government doesn't have to induce people to lend it money. During times of economic uncertainty, investors are willing to leave their money tied up at low rates just to keep it safe.

Beginning in December 2008, the Federal Reserve set a target of 0.00 - 0.25% for the Federal Funds Rate, essentially an overnight lending rate for banks. The FFR is presently 0.08%, which essentially allows banks to borrow for free. The FFR affects short term rates, but it can also impact longer term interest rates.

The Federal Reserve does not control long-term interest rates. The market forces of supply and demand determine the pricing for long-term bonds, which set long-term interest rates. However, if the bond market believes that the Federal Reserve (FOMC) has set the Federal Funds Rate too low, expectations of future inflation increase. That, in turn, will typically increase long-term interest rates relative to short-term interest rates (a steepened yield curve).

So, though the Fed doesn’t control long-term rates, its policy with regard to short-term rates sets the basis for yields on government bonds with longer maturities.

This is all a great, big gamble. Investors have accepted these low returns just to keep their money safe during a prolonged period of economic uncertainty brought on by the Wall St. meltdown, the Great Recession, the eurozone debt crisis, and the fiscal cliff.

Ultimately, rates — both long term and short term — have nowhere to go but up. If the 10-year Treasury yield gradually doubles, reaching 5.38 percent, it would still be below its 30-year average of 5.93 percent. So, it's not an unrealistic scenario.

That wouldn't just upend the bond market; it would upend life as we know it in the U.S.

Wednesday, March 26, 2014

Too Few High Tech Jobs, Too Many Fast Food & Retail Jobs


Facebook recently bought WhatsApp — a company with just 55 employees — for $19 billion. It's rather stunning that a company with just 55 employees can be valued at $19 billion. What's more, the company had estimated revenues of just $20 million in 2013, which makes the purchase price seem all the more irrational.

The acquisition is indicative of the tremendous money and growth in the tech industry. There are so many high-paying jobs in the sector, and so many millionaires in Silicon Valley, that most people would surely love to work for one of the famous (or not so famous) tech companies in the area.

But, despite their sizable revenues and market capitalization, these companies employ a relatively small number of people. For example:

Apple employs 80,300 full-time employees, plus 4,100 full time temporary employees and contractors. However, 42,800 of its employees work in the retail part of the business.
Revenue: $170.9 billion
Market cap: $446 billion

Google employs 47,756 people.
Revenue: $59.82 billion
Market cap: $268.44 billion

LinkedIn employs 43,282 people.
Revenue: $1.52 billion
Market cap: $24.92 billion

Facebook had 6,337 employees as of December 31st.
Revenue: $7.87 billion
Market cap: $134 billion

Twitter had “over 2,300 employees” when it filed for its IPO late last year.
Revenue: $664 million
Market cap: $29.16 billion

In total, these five major technology companies — the likes of which almost everyone has heard of, and where virtually all young people would feel privileged to work — employ a total of roughly 137,000 people.

For comparison, here are America's 10 largest employers, each of which has a workforce of more than 300,000 people. Combined, they employ more than 5.6 million workers.

General Electric: 305,000 total employees
Hewlett-Packard: 331,800 total employees
Home Depot: 340,000 total employees
Kroger: 343,000 total employees
Target: 361,000 total employees
United Parcel Service: 399,000 total employees
IBM: 434,246 total employees
McDonald's: 440,000 total employees
Yum! Brands: (owner of KFC, Taco Bell and Pizza Hut) 523,000 total employees
Walmart: The largest American employer has 1.3 million workers employed in the United States.

The reality is that the workforce of many of these companies is part-time, temporary and seasonal, and many of these jobs are low-paying and poor quality. The bulk of the employees in at least six of these companies (Walmart, Home Depot, Kroger, Target, McDonald's and Yum! Brands) are low wage workers.

Unfortunately, each of these companies employs more than twice as many workers as the five combined technology companies listed above. And Walmart employes ten times as many.

That's a sobering perspective.

We would all benefit from an economy built on higher-wage workers in industries such as science, technology and engineering. But those are not the type of industries that employ the masses. Moreover, those industries all require advanced degrees.

A recent analysis by the National Employment Law Project shows that low-wage positions
account for nearly three out of five jobs generated in the first three years of economic recovery.

So, while America aspires to be a 21st Century global leader — with a workforce largely comprised of well-payed, highly-skilled workers in modern, first-world industries — our economy is bogged down by far too many fast food and retail jobs.

Of course, those are the kind of jobs that keep workers and their families in poverty and on public assistance.

We need more companies like Apple and Google all around the country, not just Silicon Valley, employing millions more people.

But what we have instead are way too many Walmarts, McDonald's and KFCs.

Wednesday, March 19, 2014

Great Recession Still Casting Its Shadow Over Employment/Wages


Perhaps the greatest and most lasting scar of the Great Recession has been its affect on employment and the job market. More jobs were wiped out in the Great Recession than in any other post-World War II downturn.

According to the Department of Labor, roughly 8.7 million jobs were shed from February 2008 through February 2010. Meanwhile, about 8.4 million jobs were created since February 2010. But the remaining deficit doesn't even account for all the high school and college graduates who have entered the workforce in that span.

It's a rather stunning state of affairs. Four years after our supposed recovery took hold, we still have a significant jobs deficit. Yet, the economy needs to add 143,000 jobs monthly just to keep pace with population growth.

More than three million students are expected to graduate from high school this year, according to the National Center for Education Statistics. Additionally, 943,000 students are expected to receive associate’s degrees this year, while 1.8 million more will earn bachelor's degrees.

As a result, millions of jobs will have to be created this year just to employ this group of graduates, which doesn't include all of the currently unemployed adults who are still searching for work. This same cycle has been playing out each and every year since the recession "officially" ended.

From the late 1940s until the early 1990s, the U.S. economy never took more than a year to regain all the jobs lost during downturns. Yet, after the 1990-91 recession, it took 21 months to recover all the lost jobs. And following the dot-com bubble, when 2.7 million jobs evaporated, it took 18 months after payrolls bottomed out for them all to come back.

The pattern is clear; it is taking longer and longer to recover from each subsequent recession. But the Great recession was a different animal altogether.

While the unemployment rate has been decreasing in recent years (despite the fact that it ticked back up to 6.7 percent in February), it masks some rather troubling underlying statistics.

The number of involuntary part-time workers was 7.2 million in February, according to the Bureau of Labor Statistics (BLS). These people were working part-time because their hours had been cut back or because they were unable to find full-time work.

In February, 2.3 million people were "marginally attached" to the labor force. These individuals were not in the labor force, wanted and were available for work, and had looked for a job sometime in the prior 12 months. They were not counted as unemployed because they had not searched for work in the four weeks preceding the survey.

The Labor Force Participation rate was 63 percent in February, meaning that just 63 percent of people in the civilian non-institutional population either had a job or were actively seeking one in the previous four weeks. This group includes all people in the United States, 16 or older, who are not on active duty in the military or in an institution, such as a prison, nursing home or mental hospital.

A rate this low has become a disturbing trend, and one that may not reverse.

The average annual labor force participation rate in 2013 was 63.2 percent, a 35-year-low, according to data from the BLS. The rate peaked at 67.1 percent in 1997 and has dropped annually ever since.

A Philadelphia Federal Reserve study on the topic notes that, “retirement had not played much of a role until around 2010.” By then, the rate had already dropped 2.4 percent.

This means that retirement has not played much of a role in the participation rates up until 2010, and it seems to be only marginally affecting it now.

Yes, older people are retiring, but younger workers are continually entering the workforce, which should be helping to offset those retirements. Additionally, older Americans are staying in the workforce longer than in the past, usually for financial reasons.

What's particularly alarming is that the participation rate for workers between ages 25 and 54 fell sharply during the recession and still hasn't recovered. So, the low participation rate is not simply a matter of older workers retiring.

Younger workers have been hit especially hard by unemployment, as well as low wages. Yet, older workers — 55 and older, even those 65 and older — have been adding to the labor force participation rate. They have fared much better than younger workers.

This suggests that the economy is in much worse shape than the official unemployment rate indicates. The official jobless rate (known as U-3) is currently 6.7 percent, but that only counts people who are actively seeking work — not labor-force dropouts.

The U-6 unemployment rate was 13.1 percent in February. This calculation includes: "discouraged workers", or those who have stopped looking for work because current economic conditions make them believe that no work is available for them; "marginally attached workers", or those who "would like" and are able to work, but have not looked for work recently; and part-time workers who want to work full-time, but cannot due to economic reasons (also known as "underemployment").

Here's a troubling fact: In February, there were more than 92 million Americans not in the labor force, a record number. However, there are just 144.1 million employed workers. This ratio is quite unsettling. It means that there are just 59 percent more adults working than not working.

In other words, there aren't even two adults working for every adult that isn't. That's rather stunning.

Of the nation's 144.1 million employed workers, about 27.8 million of them are part-time. This means roughly 19 percent of all workers are part-timers.

While part-time work typically increases during recessions, the percentage of part-time jobs has remained stubbornly high since the recession officially ended. As previously noted, there were 7.2 million involuntary part-time workers in February.

Though the BLS reports the economy has added private sector jobs for 48 straight months, and job growth has averaged 189,000 per month over the past 12 months, far too many of those jobs have been of the low-wage variety.

Roughly half of the jobs created in the United States in the past three years have been low-paying jobs, according to economists at the Royal Bank of Scotland, who sent a research note sent to their clients in May 2013 titled, "A Closer Look At The Labor Market Recovery."

RBS defines "low-paying" jobs as those paying 80 percent or less of the average private-sector wage of $20.04 per hour. The sectors providing many of these low-paying jobs include retail sales, leisure & hospitality, and education.

The RBS study echoes several others in recent years, including a National Employment Law Project study from August that found three-fifths of jobs created since the recession have been low-paying, roughly matching the number of middle-income jobs that were lost.

About a third of working families in the U.S., representing about 47 million people, are in low-wage jobs today, according to the Working Poor Families Project. That's startling.

So, even as the unemployment rate has been generally trending downward with the creation of new jobs, they are not the kind of jobs that can meaningfully drive demand and consumption in our economy. To the contrary, they are the kind of jobs that keep people in relative poverty.

In fact, the U.S. now has the highest proportion of low-wage workers in the developed world, according to the Organization for Economic Cooperation and Development. One in four make less than two-thirds of the median wage, which is the same proportion that relies on public aid.

The big picture reveals a national crisis. There simply aren't enough jobs to employ the long-term unemployed, as well as all of the recent high school and college graduates entering the workforce.

When you include the number of low-paying and part-time jobs to the mix, the situation is downright bleak.

This is no way to sustain an economy, much less grow one.

Friday, February 07, 2014

Economic Squeeze: Americans Don't Have Enough Income to Drive Demand


Our economic model is based on demand and consumption. In order for the economy to continually grow, people must continually buy more stuff.

Of course, there are the everyday staples that everyone will always buy because they must, such as food, toilet paper, tooth paste, soap, etc. Spending on these basic life-essentials is considered non-discretionary because there is no choice involved. Paying for the roof over one's head is also considered non-discretionary.

Yet, what businesses and the broader economy really need is for people to also make lots of discretionary purchases. This includes things such as household furniture, appliances, cars, luxury items, vacations and entertainment, plus all other non-essential goods and services.

The problem is that household income has been shrinking for many years, leaving people with less to spend.

For many years, Americans made up the difference by using credit cards and going into debt. In essence, people were spending money they didn't have to fiance their lifestyles. But people are now taking on less debt than during the bubble years.

For example, credit card debt outstanding is 7% lower than its level in 2010 and 16% below its peak in 2008.

The debt-to-income ratio for American households is now down to 109% – well below the peak of 135% reached in late 2007. But it's still 35 percentage points above the average of the final three decades of the twentieth century, according to Yale economist Stephen Roach.

In other words, Americans still have a lot of work to do to pay down their rather substantial debts.

The personal savings rate also remains below past levels. The savings rate fell to 4.48 percent in 2013, according to the Bureau of Economic Analysis.

After turning negative in 2005 for the first time since the Great Depression, and staying that way for about two years, the savings rate then began to climb, reaching a high of 6.1% in 2009.

After witnessing the collapse of the debt bubble, Americans were trying to pay down their debts as the financial crisis was still unfolding.

But the savings rate quickly returned to a downward trajectory the very next year, falling to 5.6 percent in 2010. It stayed relatively stable for the next two years: 5.7 percent in 2011, and 5.6 percent in 2012.

So, the decline to 4.48 percent in 2013 was rather substantial, amounting to a 20 percent drop.

As the Baby Boomers continue to retire each year and draw down on their retirement savings, the savings rate will be driven down even further.

There are a couple of different perspectives on the savings rate.

On the one hand, if people are saving, they are not spending, which tends to hold back economic growth. On the other hand, if people aren't saving, there is less money for national investment, meaning money is instead borrowed from overseas. As it stands, that's already a big problem for the U.S.

People haven't been able to save because they don't have the means. Incomes have fallen considerably. In past decades, people made up for that fact by going further into debt. This helped prop up economic growth. But there was an eventual and inevitable reckoning, as people came face to face with an enormous pile of debt that had become overwhelming.

So, Americans are now spending less now than in the bubble years of the last decade. Home equity has been crushed, leaving nothing for them to extract and spend.

This is all bad news for retailers and for the economy in general, since consumer spending accounts for more than 70 percent of GDP.

However, our economic decline was quite predictable. Real median household income is now at 1990 levels. Yes, that's how far backward the typical American household has fallen.

In 1970, the inflation-adjusted median household income was $45,146.
In 1980, the inflation-adjusted median household income was $46,024.
In 1990, the inflation-adjusted median household income was $49,950.
In 2000, the inflation-adjusted median household income was $54,841.
In 2010, the inflation-adjusted median household income was $50,831.

This means that household incomes barely budged for a couple of decades, and then they went backward in the last decade. Americans are making roughly the same amount today, in inflation-adjusted terms, as they were making back in 1990.

Yet, the problem of falling incomes stubbornly persists. Median household income after inflation fell again in 2011, to $50,054. After falling 0.5% in 2011, inflation-adjusted wages declined 0.4% in 2012.

Simply put, wages aren't keeping up with inflation.

Yet, the cost of everything continues to rise. For example, the price of gasoline over the last three years has been at its highest point ever. Gas prices in 2013 were the second highest in history, trailing only 2012, which saw the highest average price. And the third highest average price was in 2011.

Oil prices have surged from $25 per barrel in 2003 to $100 per barrel today. That has raised the cost of virtually everything in our economy. All goods that are transported are more costly as a result.

Outstanding student loan debt has reached a whopping $1.2 Trillion, which means that more than 40 million Americans are not buying houses or cars, starting businesses or families, or otherwise creating demand in the economy.

As previously noted, there are fewer people spending because they have less income to spend. But, additionally, there are fewer people working. The labor participation rate is at its lowest level in 35 years, a time when the economy was in recession.

There are 247 million working age Americans between the ages of 16 and 64 (those not in the military, jail/prison, mental facilities or homes for the aged). Only 155 million of them are employed. This means that 92 million working-age people are not working.

While some on these people are retiring, once someone turns 65 they are no longer counted in the work force. Yet, the number of 'working age' Americans is continually growing since thousands of teenagers turn 16 every day and are considered part of the labor force.

It's a sad fact that the labor force participation rate was just 62.8 in December. The figure hasn't been that low since at least 1978. Again, a whopping 92 million working age people simply aren't working.

The problem is there are too many people looking for too few jobs. At present, there are three applicants for every available job nationwide.

Then there's the additional problem of low-paying jobs. Nearly two out of three new jobs created from January through August last year were part time.

During the supposed recovery, there have been far more low-wage jobs created than high-wage jobs.

Between 2009 and 2013, low-wage jobs outnumbered high-wage jobs by some 800,000, with 1.7 million versus 1.1 million jobs. Though low-wage jobs made up less than one in five (19 percent) of all employment in 2009, they accounted for nearly 40 percent (39 percent) of all new jobs created out to 2013.

Put all these pieces together and you realize why demand and consumption are so low, and why economic growth has been so weak.

Growth rates in the U.S. have been decreasing for decades. In the 1950’s and 60’s, the average growth rate was above 4 percent. But in the 1970’s and 80’s, it dropped to around 3 percent. And in the last ten years, the average rate has been below 2 percent.

In fact, the U.S. economy has not surpassed 3 percent annual growth since 2005. Last year likely continued that trend. The advanced estimate for economic growth in 2013 is 2.7 percent, according to the White House. That number will be revised a couple of times in the coming months.

Think of it as the new normal.

There is, however, plenty of money still in the U.S. economy. It's just being siphoned off to the richest 1 percent.

The average CEO-to-worker pay ratio in 2012 was 354 to 1. That is far more than the ratio in other developed countries.

In the 1970s and early '80s, the U.S. ratio was roughly 20 to 1.

While most Americans continue to struggle financially, and even regress, the rich just keep getting richer.

The United States has led a worldwide growth in wealth concentration, according to a recent Oxfam report, titled "Working for the Few."

The percentage of income held by the richest 1% in the U.S. has grown by nearly 150% since 1980. That small elite has received 95% of wealth created since 2009, after the financial crisis, while the bottom 90% of Americans have become poorer, Oxfam said.

The new normal is plainly abnormal, even despicable.

Wednesday, January 08, 2014

Disequilibrium: Debt Growth vs. Economic Growth


Despite its difficulty generating consistently strong economic growth, the U.S. is having no trouble growing its already sizable debt.

For years now, I've discussed the slower U.S. economic growth rates on this page, and all of the reasons for this. Growth has been slowing for many years and the downward trend will likely continue well into the future, perhaps to the point of zero growth.

Since 2001, GDP has only reached at least 3 percent in two years: 2004 (3.8 percent) and 2005 (3.4 percent). In every other year, through 2012, GDP failed to crack even 3 percent, a number that was once considered customary.

We won't know for another couple of months how much the U.S. economy grew in 2013, but we already have some estimates.

The Federal Reserve projects that the economy grew between 2 percent and 2.3 percent in 2013.

However, Kiplinger projects that, on the heels of the sequester and government shutdown, the economy grew just 1.8 percent in 2013.

Meanwhile, the Conference Board projects that the economy grew 1.7 percent last year.

Growth has been, and will likely remain, a challenge. The economy will have to expand much faster than those estimates just to keep up with the nation's continually mounting debt. The U.S. needs a combination of growth and inflation to pay off years of already accumulated debt.

The national debt has surpassed $17.3 trillion and continues to grow each and every month. Since all money is loaned into existence, and is therefore created as debt, the process of perpetual debt growth will continue until the system can no longer sustain itself and ultimately collapses.

While funding our massive debt expansion, the Federal Reserve is concurrently increasing, or inflating, the nation's currency. This process devalues our money.

By devaluing the dollar through the process of money printing (or quantitative easing), the Federal Reserve is simultaneously trying to create an export boom while also reducing the impact of the national debt.

A devalued dollar makes American goods cheaper overseas, and it also makes paying down existing debts easier because those dollars are worth less. In essence, it allows a nation to repay its creditors with money that is worth less than the money that was lent.

If the economy were growing strongly enough, it would help to offset the continually expanding debt to some degree. But that is not the case.

Historically, from 1948 through 2012, the United States' annual GDP growth rate averaged 3.21 percent.

Yet, as with many other developed nations, U.S. growth rates have been decreasing over the last two decades. In the 1950’s and 60’s the average growth rate was above 4 percent. In the 70’s and 80’s it dropped to around 3 percent. And in the last ten years, the average rate has been below 2 percent.

Some contend that the U.S. can simply grow its way out of debt. This is delusional. The historical data shows a consistently downward trend in growth, coupled with a steady growth in debt.

Since about 1980, debt has been growing much faster than GDP. But it is not possible to continually grow your debts faster than your income.

Consider America's economic growth rate over more than two centuries — essentially the entire existence of this nation. Over the past 220 years, U.S. GDP has averaged an annual growth rate of 3.8 percent.

Yet, between 1980 and 2013, total credit market debt (corporate, state, federal and household borrowing) grew by a whopping 8 percent per year. Anything growing by 8% per year will double every nine years. That is plainly unsustainable.

It's quite optimistic to believe that the U.S. economy, which hasn't surpassed 3 percent annual growth since 2005, can sustain a 3.8 percent rate going forward. Even if it did, an annual growth rate of 3.8 percent cannot support annual credit growth of 8 percent.

The total U.S. debt-to-GDP ratio currently stands at around 350 percent. That extraordinary debt level is already hindering economic growth. The stark reality is that we cannot, and will not, grow our way out of debt. Debt growth is simply outpacing economic growth.

After four consecutive years of trillion-dollar deficits, the fiscal 2013 deficit fell to $680 billion. This is being celebrated in Washington as a real sign of progress, even a victory. While the fact that the deficit has fallen for the last three years is a good thing, let's be clear: by any definition, the U.S. still has an absolutely massive deficit.

Let's take the most optimistic view: At $680 billion, the fiscal 2013 deficit was 51 percent less than in 2009, when it hit a nominal record high of $1.4 trillion. As a percent of the economy, the deficit is also considerably smaller than it's been in the past five years, coming in at 4.1 percent of GDP. By contrast, the budget deficit in 2009 topped 10 percent of GDP. And last year it was 6.8 percent.

But no matter how you spin it, this nation is still faced with a continual budget deficit that is adding to the national debt each and every year.

Here's a key data point: Federal revenues for fiscal 2013 were $2.77 trillion, yet the government spent $3.45 trillion. Given its deficit of $680 billion, this means that the government spent 25% more than it received in taxes. It also means that deficit spending represented nearly 20% of the entire federal budget.

And that was considered progress.

With all of this in mind, you have to possess an extraordinarily optimistic point of view to perceive the $680 billion deficit as a reason for celebration or back-slapping.

Furthermore, the U.S. made $415.6 billion in interest payments in 2013, nearly 16% higher than in 2012. Our debt has massive costs and it robs from critical domestic needs.

If the interest rate on the national debt just went up to the 20-year-average rate of 5.7 percent, almost all tax revenue would go toward paying the interest — leaving nothing for healthcare, food stamps, bridges and roads, social security, or defense. Just interest on debt.

The Congressional Budget Office (CBO) says it, "expects interest rates to rebound in coming years from their current unusually low levels, sharply raising the government’s cost of borrowing."

What's critical to consider is that even if the government somehow balances its budget and eliminates deficits going forward, it still wouldn't address the trillions in underlying debt. It would simply stop adding to it. In essence, it would just stop digging a deeper hole.

By 2038, the CBO projects that "the federal government’s net interest payments would grow to 5 percent of GDP, compared with an average of 2 percent over the past 40 years, mainly because federal debt would be much larger."

The most vexing problem for the U.S. going forward will be its inability to grow the economy adequately enough to manage all of the new debt that will continually be added each and every year in the decades ahead.

The nation will have to make some really difficult decisions about how much government it wants to pay for. One thing is certain; current tax and spending levels will have to be altered in the years ahead. The economy simply won't grow enough to pay for all future expenditures based on current levels, much less all the interest on our mountainous debt.

That debt will continue to squeeze the economy and the federal budget. As I've said previously, tough choices lie ahead.

As the CBO notes, "At some point, investors would begin to doubt the government’s willingness or ability to pay U.S. debt obligations, making it more difficult or more expensive for the government to borrow money."

That's a predicament the U.S. has never before faced in its history. While such a scenario was once unimaginable, it is now likely.

Thursday, December 19, 2013

Pentagon Spending Undermining US Economy


In fiscal year 2014, the federal government will spend around $3.8 trillion. Of that total, military spending will occupy $831 billion. This includes spending on military defense ($626.8 billion), veterans aid ($148.2 billion), foreign military aid ($14.3 billion), the war in Afghanistan ($92.3 billion) and the Department of Energy's nuclear weapons programs ($7.9 billion).

This massive sum takes into account the sequester, which forced the Pentagon to slice $52 billion from its budget for the 2014 fiscal year that began October 1.

Military spending is second only to Social Security. However, Social Security is funded by the payroll tax, which is paid by every working American.

Military spending, on the other hand, comes from the federal government's general fund. In other words, military spending comes at the expense of other domestic programs and needs.

U.S. government spending is divided into three groups: mandatory spending, discretionary spending and interest on debt.

Discretionary spending refers to the portion of the budget which goes through the annual appropriations process each year. In other words, Congress directly sets the level of spending on programs which are discretionary. Congress can choose to increase or decrease spending on any of those programs in a given year.

Military expenditures account for 57 percent of discretionary spending.

It is quite justifiable for the U.S. to have a goal of maintaining the world's most powerful military, and one that spends the most money to provide for that. However, it is not justifiable for the U.S. to grotesquely outspend not only any conceivable enemy, but essentially the rest of the world combined.

In 2012, U.S. defense spending was six times more than China, 11 times more than Russia, 27 times more than Iran and 33 times more than Israel.

In fact, the U.S. consumed 41 percent of total global military spending that year.

It's not just that the U.S. has a bigger budget and can therefore spend more. The U.S. was also in the top 10 highest spending countries as a percentage of Gross Domestic Product (GDP).

Unnecessary Pentagon spending creates fewer jobs than every other form of federal spending, including tax cuts to promote personal consumption. In fact, it destroys American jobs if the money for it comes out of our domestic economy, according to a 2011 study by the University of Massachusetts.

This study focuses on the employment effects of military spending versus alternative domestic spending priorities, in particular investments in clean energy, health care and education.

The study compared spending $1 billion on the military versus the same amount of money spent on clean energy, health care, and education, as well as for tax cuts which produce increased levels of personal consumption.

The authors concluded that $1 billion spent on each of the domestic spending priorities will create substantially more jobs within the U.S. economy than would the same $1 billion spent on the military.

The study also concludes that investments in clean energy, health care and education create a much larger number of jobs across all pay ranges, including mid-range jobs (paying between $32,000 and $64,000) and high-paying jobs (paying over $64,000).

Ultimately, all of this unnecessary military spending is bloating the federal budget, driving the deficit and piling onto our ever-expanding debt.

Admiral Mike Mullen, former chairman of the Joint Chiefs of Staff, gave Congress a very powerful warning in 2010.

"I think the biggest threat we have to our national security is our debt," the Admiral intoned.

It would be wise to heed his admonition.

Wednesday, December 04, 2013

By Almost Any Measure, the U.S. Healthcare System Is Failing


The U.S. spends more on healthcare each year than any other country in the world. Yet, according to a new report, the spending problem isn't the result of our rapidly growing segment of seniors.

Instead, most of the money is being spent on people under age 65, and it is being directed toward chronic and preventable conditions, such as diabetes and heart disease.

The U.S. spends a whopping $2.7 trillion per year on health care, or nearly 18 percent of gross domestic product (GDP). But the nation gets relatively little for the enormous amount it is spending. In fact, "The U.S. ‘system’ has performed relatively poorly,” reads the report.

The report, co-written by Dr. Hamilton Moses of the Alerion Institute in Virginia and Johns Hopkins University, had a rather surprising conclusion.

“In 2011, chronic illnesses account for 84 percent of costs overall among the entire population, not only of the elderly. Chronic illness among individuals younger than 65 years accounts for 67 percent of spending."

Despite the conventional wisdom, quite remarkably, the problem isn't old people.

The "price of professional services, drugs and devices, and administrative costs, not demand for services or aging of the population, produced 91 percent of cost increases since 2000,” reads the report.

Dr. Moses says that unlike a normal market, the healthcare market has no price discovery. Consumers operate in the darkness, entirely unaware of how much they are paying or what they are paying for. There are no market forces reigning in costs because healthcare in the U.S. doesn't exist in a true market.

“This is not a market," Moses says. "It’s far from a market. Few prices are known. They are not publicized.”

Moses also says his team’s study shows that one of the biggest problems in the U.S. healthcare system is that it is based on a fee-for-service model in which doctors and other caregivers are motivated to give lots of tests and individual treatments, as well as to prescribe drugs, instead of keeping patients well.

In other words, it's all about the treatment of illness and disease, rather than prevention. If the system was based on performance and outcomes, we'd be spending a whole lot less money.

Yet, individuals can play a bigger role in their own health and wellness than any doctor simply by making lifestyle choices that will lessen sickness, improve quality of life, and perhaps even longevity.

Keeping people from being afflicted by preventable diseases in the first place is the best way to reduce medical costs.

Some people contend that the U.S. has the world’s best health care system. But that claim simply doesn't square with the facts.

A study released in November (which was many years in the making) shows that Americans pay more per capita for health care than people in any other industrialized country. In return, we are sicker and die younger.

The Commonwealth Fund, which does research on health care and health reform, has continually shown that Americans spend far more on health care than any other nation — currently $2.7 trillion annually. That amounts to $8,508 per person, compared to $5,669 per person in Norway and $5,643 in Switzerland, the next-highest-spending countries.

In other words, no other nation's spending is even close to ours — even on a per capita basis.

Yet, all that money isn't buying us much. There's very little return on the investment.

The U.S. has the eighth-lowest life expectancy in the Organization for Economic Co-operation and Development (OECD), a group of 34 developed nations.

Commonwealth Fund researchers found that 37 percent of Americans went without recommended care, did not see a doctor when sick, or failed to fill prescriptions because of costs, compared to as few as 4 percent to 6 percent in Britain and Sweden.

Additionally, 23 percent of American adults either had serious problems paying medical bills or were unable to pay them, compared to fewer than 13 percent of adults in France and six percent or fewer in Britain, Sweden, and Norway.

But what about access? Defenders of the U.S. system say Americans have a much easier time seeing their physician than patients in other countries. Not so.

Americans wait longer to see primary care doctors. In Germany, 76 percent said they could get a same or next-day appointment, and 63 percent in the Netherlands said the same. Meanwhile, just 48 percent in the U.S. said they had that level of access. In fact, only Canada scored worse, with 41 percent saying they could see their doctor that soon.

Sadly, the U.S. health system is plagued by problems.

An Institute of Medicine report released in 2012 found that the U.S. health care system wasted $750 billion in 2009 (about 30 percent of all health spending) on unnecessary services, excessive administrative costs, fraud, and other problems.

The Institute also found that as many as 75,000 people who died in 2005 would have lived if they got the kind of care provided in the states with the best medical systems.

Quite plainly, all of the arguments that the U.S. healthcare system is the greatest in the world are plainly false or, at the least, misleading. By almost any measure, the U.S. lags the developed world, and even many developing nations.

Not only do Americans pay significantly more per capita for their healthcare than the citizens of any other nation on earth, they are also fatter, sicker, have less access, and die younger than those in other industrialized countries.

It's still unclear whether the Affordable Care Act (aka, Obamacare) will positively affect any of this, but it had better. The current state of affairs isn't just unacceptable; it's untenable.

Monday, November 18, 2013

American Poverty and Economic Decay Being Driven by Low Wage Jobs


You may notice the signs of economic decay all around in your community. Perhaps you have personally experienced (or are still experiencing) joblessness, the need for government assistance, or are somehow living on the edge economically.

One way or another, there are numerous signs that our economic security has deteriorated and that the American dream has faded away.

Nearly 50 million Americans (49.7 Million) are living below the poverty line. But the level of economic insecurity goes well beyond those officially recognized by the government as living in poverty.

According to The Associated Press, four out of five U.S. adults struggle with joblessness, live near poverty, or rely on welfare for at least parts of their lives. That amounts to roughly 80 percent of American adults, a figure that is simply mind-blowing.

However, poverty is not problem that plagues only racial and ethnic minorities. More than 19 million whites fall below the poverty line of $23,021 for a family of four, accounting for more than 41 percent of the nation’s destitute — nearly double the number of poor blacks.

Economic insecurity afflicts more than 76 percent of white adults by the time they turn 60, according to a new economic gauge to be published next year by the Oxford University Press. Measured across all races, the risk of economic insecurity rises to 79 percent.

“Economic insecurity” is defined as experiencing unemployment at some point in one's working life, or a year or more of reliance on government aid (such as food stamps), or income below 150 percent of the poverty line.

Millions of Americans cycle in and out of poverty at various points in their lives; four in 10 adults fall into poverty for at least a year.

The risk of falling into poverty has been rising in recent decades, particularly for those in their prime earning years (ages 35-55). For example, people ages 35-45 had a 17 percent risk of encountering poverty during the 1969-1989 time period. However, that risk increased to 23 percent during the 1989-2009 period.

The future projections are quite sobering. Based on the current trend of widening income inequality, close to 85 percent of all working-age adults in the U.S. will experience bouts of economic insecurity by 2030.

Yet, government safety net programs are the only thing keeping millions of additional Americans from falling into poverty.

The nation's poverty rate was 16 percent in 2012, according to new Census Bureau data that looks at how benefits and expenses affect family resources. Social Security, for example, kept 26.6 million Americans out of poverty last year. Food stamps provided by the Supplemental Assistance Nutrition Program, or SNAP, kept another 5 million people above the poverty level.

The main reason people fell into poverty last year was out-of-pocket health care expenses.

There are a near-record 47.6 million Americans, representing 23.1 million households, on the SNAP program. In other words, the program helps one in seven Americans put breakfast, lunch and dinner on the table.

Even as the stock market soars to new heights and income disparity widens to Great Depression-era levels, SNAP participation has doubled over the past 10 years and increased nearly 25 percent over the past four.

The cost of the program will reach $63.4 billion in 2013.

Poverty is becoming so widespread that it is creating a culture of government dependence. But safety net programs are becoming increasingly difficult to subsidize, given the portion of Americans who draw upon these various programs rather than fund them.

Tens of millions of Americans earn so little that they pay no federal income taxes. These folks do, however, pay payroll taxes, federal excise taxes (on things like gas, tobacco, alcohol and airfare), state taxes and local taxes.

A report from the Tax Policy Center (TPC) finds that 43 percent of Americans paid no federal income tax last year. About half of them earned too little to qualify, and many more were retired people who live on Social Security. In fact, two-thirds of this group are elderly. The remaining households likely qualified for tax breaks such as the Earned Income Tax Credit or the Child Tax Credit.

However, more than 70,000 households with income over $200,000 paid no federal income tax in 2013, according to the TPC.

The biggest culprit in all of this is low wages and incomes, which chokes off demand and consumption — the basic components of economic growth. Consumer spending comprises 70 percent of our GDP. Low wages and incomes are also starving the Treasury of much needed tax revenue.

Since seven out of the 10 fastest-growing U.S. occupations pay less than the national median wage, more and more Americans are forced to rely on the social safety net.

To illustrate this point, a whopping 52% of fast-food employees’ families are forced to rely on public assistance for food and medical due to low wages, which means American taxpayers are picking up the tab for corporations that pay poverty wages.

The average fast-food worker is now over 28 years old, meaning many support families with a combination of low fast-food wages and public assistance. That assistance is provided by American taxpayers.

A recent report from the University of California, Berkeley Labor Center estimated the cost of this at nearly $7 billion per year.

This puts a tremendous burden on American taxpayers, who have to fund these low-wage workers because their employes won't adequately do so.

Obviously, there are limits to the carrying capacity of the 57 percent of Americans who pay the federal income taxes that fund most safety net programs.

According to a recent in-depth study from the Heritage Foundation, "128,818,142 people are enrolled in at least one government program," based on U.S. Census Bureau information.

To be fair, the bulk of them are receiving Social Security (35,770,301) and Medicare (43,834,566) benefits, which all workers pay throughout the course of their working lives.

However, Heritage researchers note that 48,580,105 people are on Medicaid, the health insurance program for the poor, and 6,984,783 people are living in subsidized rental housing.

There has always been poverty and there will always be poverty. It's as old as society itself. Some people will always be more skilled, more educated and more industrious. So, they will typically earn more as a result.

But there are millions of Americans working two jobs to get by, putting in as many as 80 hours per week. These people are not poor due to a lack of will, effort or hard work. And, as I recently reported, most American households now have at least two adult workers.

Fifty-eight percent of the jobs created during the "recovery" have been low-wage positions, according to a 2012 report by the National Employment Law Project. These low-wage jobs paid a median hourly wage of $13.83 or less.

Even worse, 30 million Americans are scraping by on the federal minimum wage. That’s one in five people with a job.

Someone working full-time at the federal minimum wage of $7.25 makes $15,080 in a year, before taxes. The federal minimum wage has been stagnant for 45 years because it hasn't kept pace with inflation.

Back in 1968, the minimum wage in the United States was $1.60 an hour. After you account for inflation, that is equivalent to $10.74 today.

If you were to work a full-time job at $10.74 an hour for a full year, you would make about $22,339 for the year.

That's not a lot of money. Yet, according to the Social Security Administration, 40.28% of all American workers make less than $20,000 a year.

This means more than 40% of all U.S. workers actually make less than what a full-time minimum wage worker made back in 1968.

That's how far we have fallen.

Low-wage jobs have undermined our economy and our society. They have swelled the ranks of the working poor, created a surging dependence on taxpayer-funded welfare programs, robbed the federal tax base and driven down demand and consumption, making a genuine economic recovery an impossibility.

Economic security is merely a fantasy for millions of Americans who have watched their American dreams fade to black like the final frames of a sad movie.